

See the system.
Including the parts no one watches.
Enterprise observability across network, infrastructure, applications, databases, and logs — unified into one operational picture.
What’s inside
The pieces that make enterprise observability work.
NMS
Network Management — devices, interfaces, fabric health at scale.
NPM
Network Performance Monitoring — flow and path-quality visibility.
NPMD
Network Performance Monitoring + Diagnostics — root-cause for net incidents.
APM
Application Performance Monitoring with distributed tracing and code-level insight.
Database Monitoring
Slow queries, locks, replication health — performance visibility into your data layer.
Log Analytics
Unified log search, alerting, and retention — operational and security workloads.
One pane, every layer.
Network, infrastructure, application, database, and log telemetry unified into one operational graph — so causes and effects align.
- Unified telemetry
- Cross-layer correlation
- Lineage to root cause

Diagnose, not just detect.
NPMD and APM together explain why — so MTTD shrinks and MTTR shrinks faster.
- Distributed tracing
- Path-quality diagnostics
- Code-level insight
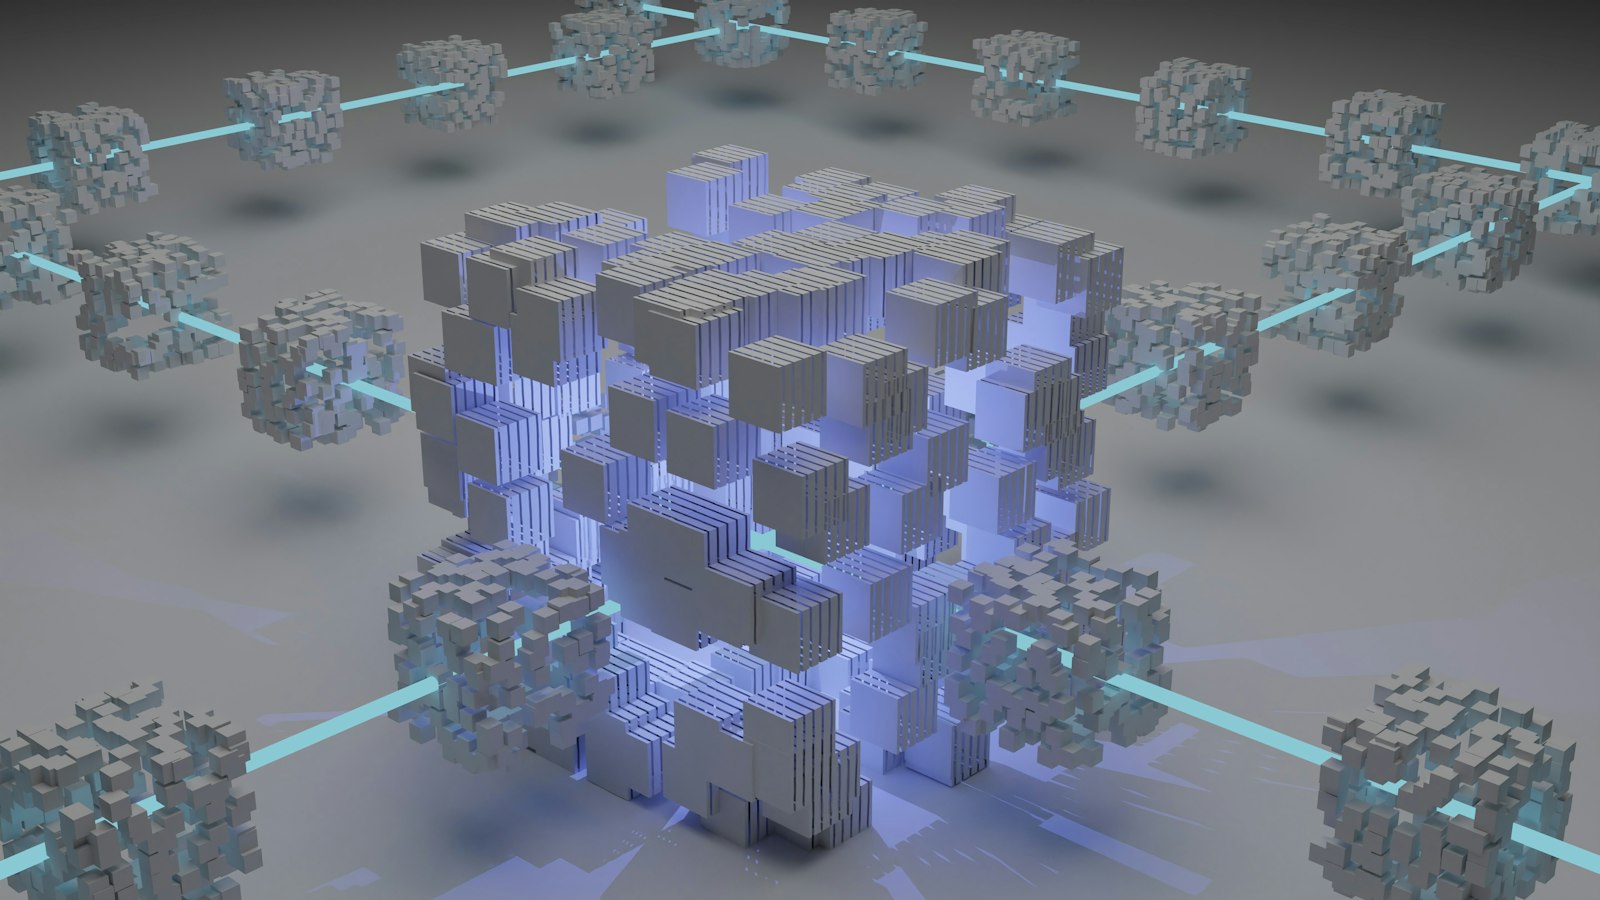
Open by design.
OpenTelemetry-first, vendor-flexible, and ready to feed AIOps and self-healing workflows.
- OpenTelemetry-first
- Vendor flexibility
- Feeds AIOps + self-heal

Use cases
Where teams put this to work.
Observability programme
Stand up enterprise observability across all layers.
APM rollout
Bring code-level insight to critical applications.
Log analytics
Unified, performant log search at enterprise scale.
Continue exploring
Other solutions, same outcome.
Ready to work on enterprise observability?
Bring us your environment, your constraints, your goals — we’ll bring the senior people who’ve solved this before.